Observations at IOM Nationals 2011
Kogarah Bay January 14th and 15th 2011
Volunteering as a helper for the last two days of the Australian championships turned out to leave some spare time, and I amused myself by taking some wind and leg time readings. Lots of people came up to me asking “what’s the wind strength” or “how fast are the boats going”. This article gives some answers to these questions.
The course covers a bit over 100 metres along the shoreline. Compass readings from a couple of points enabled the buoy locations to be fixed reasonably for the first race. Of course the buoys were moved regularly, but the long windward and leeward legs were kept pretty much the same length of 114 metres for the windward leg and 100 metres for the downwind one. These lengths were used to calculate the speeds in the diagrams.
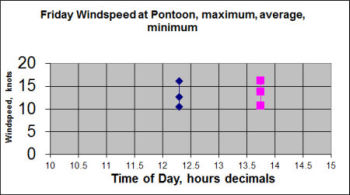
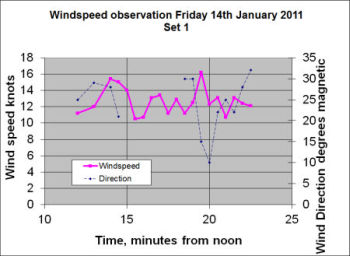 The plan was to take wind direction and strength readings for as long as we could every 30 seconds. The last time I did this was about 30 years ago up on Dobroyd Point on Sydney harbour but then it was only direction. It proved to be a real challenge to get down low enough to sight the compass. Two sets of readings over a reasonable time scale were done on the Friday plus a few spot values plus observations for the duration of two races on the Saturday with maximum, minimum and average speeds recorded over the race period.
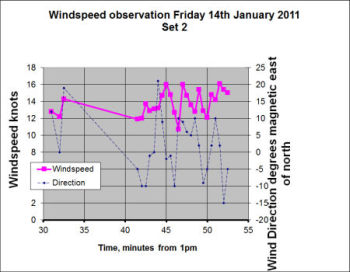 All were taken at about 500 to 800 mm above the water because this is the range acting on the boats. They are thus less than the wind strengths people are used to talking about, which are typically those at about 10 metres up. The wind speeds were measured from the pontoon, and it became obvious that the wind there was affected by the presence of the pontoon itself and the proximity to the shoreline. This made the direction measurements more erratic and the wind speed readings couple of knots or more lower than out on the course. The results recorded are shown in the diagrams and should be viewed with this in mind.
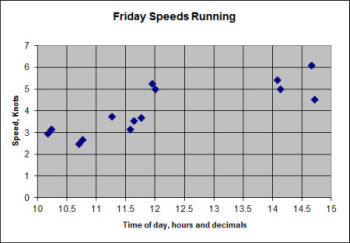
The measurements of boat speeds were made by timing the first boat to each buoy. If the lead had changed this meant that the new leader had travelled faster than shown, but the difference is quite small. I was surprised at how short the legs were. On the Friday, the times for the windward leg were very consistent with the shortest time of 2 minutes 15 seconds and a longest time of 2 minutes 23 seconds. This in spite of the change in windspeed. Downwind there was a much greater spread, from 79 seconds to a blistering 32 seconds. The big variation seemed to depend on whether there were convenient waves to surf on, Brad Gibson put up the fastest by surfing almost the whole way.
On the Saturday the times were much higher. For the windward leg, the longest was 4 minutes 40 down and the shortest 3minutes. For the downwind leg the longest and shortest were 3 minutes and 2 minutes 40 sec.
 The diagrams show the boat speed as a function of the time of the start of the leg. In the absence of better data, upwind speeds were calculated assuming that the boats sail at 45 degrees to the true wind. In the C rig conditions this is probably too little and I would guess the boats went up to 0.2 knots faster than shown.
 The displacement length ratio (a measure of how heavy a boat is for its length) of an IOM is roughly he same as an NS14 or Tasar. The old “hull speed” or what Bethwaite calls the start of the “forced mode” happens in these boats at about 1.4 Sqrt(L) knots where L is the waterline length in feet. In IOM’s this will happen a bit later because they are less beamy, so for IOMs the forced mode starts somewhere close to 2.5 knots. Using the same comparison, the flat out planing mode starts at a bit under 4 knots.
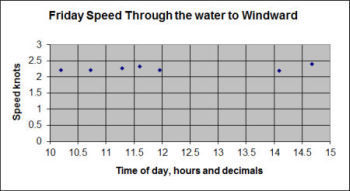 On Friday the diagrams show that in winds averaging 12.5 to 16+ knots over the period, the boats were achieving speeds of 5 knots routinely and one blistering run of 6 knots. There was clearly a lot of flat out planning and surfing downwind. Upwind the speeds were less but very consistent in the range 2.2 to 2.4 knots through the water.
 |
 |
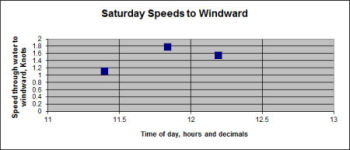 |
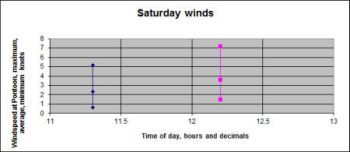
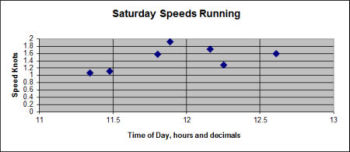
On Saturday the winds were much lighter, averaging 2.5 to just under 4 knots and peaking at 5 to 7 knots, very much A rig range. Speeds downwind were 1 to 2 knots, largely determined by how long the lulls lasted. This time the speeds through the water to windward were only slightly lower than those downwind.
Waves played a big part on Friday but were not much of an issue on Saturday. For some reason the waves on Friday were travelling close to NE although the winds were nearer North. This meant a very different speed through the water on port tack, where the boats had to sail almost directly into the waves to starboard tack where they sailed along the waves. This broke the heart of several inshore tackers who initially seemed to very well, only to lose as they went onto port tack to make the buoy. At one stage this effect was particularly nasty as breaking waves developed near the inshore end of the finish line. It put me in mind of the old IOR masthead boats tacking north with an easterly swell. They would ease the backstay to make the genoa fuller and sheet out a bit to get power to breast the waves on the port tack out, and then crank it all on for the easier starboard leg along the coast.
On Friday some observations were made of the wave period and estimates made of their length and height. At about 11.30 on Friday the period was measured at 1.5 to 1.6 seconds, the length estimated at about 1.5+ metres and the height at about 100mm. By 1430 the period had increased to around 2.5 seconds, the length estimated at 2m + and the height 200mm. By the end of the day the waves were estimated as 3m long and about 300 high, hence the magic surfing. The tide was not a high one on Friday with a low of .69m at 10.47, a high of 1.12m at 1630. Even this was enough to show a definite “wind over tide” condition. The boats seemed to struggle more with the shorter waves in the morning where they tended to slam into the wave fronts. In longer waves of the afternoon they were able to sail up and over them.
That’s all for now, hope it’s of interest,
Colin Thorne January 2011