Estimating the hull drag of an IOM Yacht (August 2014)
1.0 Introduction
Hulldrag.zip is the spreadsheet, click on it to download, ignore any message about updating from other spreadsheets.
This article presents a downloadable spreadsheet for estimating the drag of IOM hull designs. All that is required is to enter some numbers from a normal design program into a space in the "Input Data" sheet and the spreadsheet does the rest, giving graphical output for up to three hulls at once to allow comparisons. No mathemeatrical knowledge is required.
The spreadsheet was made using Windows 8.1 and Office 13 but will work on modern Apple computers, and has been shown to work on Windows7/Office 2003 PCs. The method can be applied to other model yachts but the accuracy would be uncertain, particularly in the skin drag calculation which may underestimate the drag of smaller yachts such as RG65s. In addition, most Marblehead and 10 Rater designs are too slender for the residual drag part of the calculation.
The drag of a boat through the water is generally considered to consist of::
Skin drag, that is the drag that comes from the water rubbing on the hull, this is based on normal naval architecture methods modified to suit the observed drag values described in Hulls/ Drag Measurements on an International One Metre Yacht on this website.
Residual drag which is mostly wave making drag, and is often called that. This is based on the Delft Yacht Series method described in Keuning (2008).
Details of the calculation methods are given in the Appendix. The method for residual drag is based on a more recent Delft Series method than that in Delftship or Freeship neither of which can accommodate normal IOM shapes because they are based on wider models, and the minimum IOM water line beam for which they are valid is 200mm as compared to just under 170mm for the more recent method in the spreadsheet. In addition, these methods cannot deal with the very low Reynold’s numbers that apply to the skin friction of model yachts, whereas this spreadsheet is specifically tailored to suit these low Reynold’s numbers.
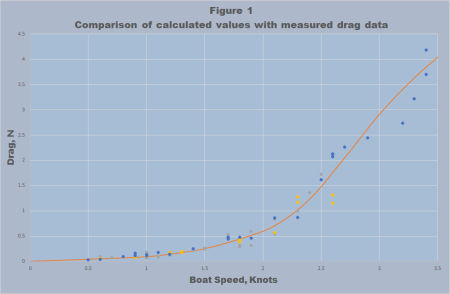 Measurements of the drag of several IOM yachts has been made and the comparison of these measurements with the spreadsheet predictions are shown in Figure 1. The agreement appears satisfactory, although conditions during the higher speed runs over 3 knots were not ideal, and the apparent “hump” should not be taken as fact.
It must be realised that, though it is important, the upright drag is not the only factor in hull performance. Some other factors are heeled drag, pitch tolerance (including nosediving behaviour), and wave impact drag.
The spreadsheet uses hydrostatic values that most design programs such as Delftship, Freeship amd MacSurf, will provide. If a program is available that will give these parameters for a hull when heeled, or at a different pitch, this spreadsheet may be used to give an estimate of the drag in those situations as suggested by Fossati (2009). The author uses Hullform 9P (this is now a free download) for this because, although it is harder than some to get a fair hull, the hydrostatics package will calculate the hydrostatics values for the hull at different heel and pitch angles.
The rest is up to intuition, judgement and experience!
2.0 Using the spreadsheet
There are five sheets in the spreadsheet:
2.1 Input Data
This is where data is input. The spreadsheet can handle 3 sets of boat data at a time. This sheet also has an area for archiving data for many boats. To use the workbook copy the hydrostatics data onto the input data sheet in columns D E or F, lines 4 to 16. Remember to give your hull a name. Check the warnings columns K, M and O to see if the data falls within the limits of the Delft Series, if it does not, the accuracy will be compromised, though small deviations are probably OK. Do not alter anything but the column of data. The green area shows the units required and gives a description of each factor. Data for boats that are not wanted for comparison can be stored in the archive area. It is recommended at first to retain at least one of the better boats that come with the spreadsheet for comparison.
Two parts of the input data need some clarification: the first is the displacement and the other is the definition of LCB and LCF.
2.1.1 Displacement
Since an IOM weighs 4 kilograms it might be thought that this would be the displacement to enter into the spreadsheets, but this is not so. The displacement entered is a volume not a mass and so is in cubic metres for one thing, the other is that the keel rudder and bulb displace water and hence the hull does not have to support the full 4 kilos. The weight of two different keel/bulb combinations were measured in air and water and the displaced volume calculated. The results are given in Table 1.
Table 1 Displaced Volumes of keel and bulb
|
Keel |
TS2style |
Craig Smith keel and Sails etc. Bulb |
|
Max Chord, mm |
83.5 |
|
|
Bottom Chord, mm |
83.5 |
|
|
Thickness % |
6 |
|
|
Weight in Air, g |
2484 |
2488 |
|
Weight in Water, g |
2147 |
2198 |
|
Displaced Volume, m^3 |
.000340 |
.000290 |
Most modern boats have keels much the same as in the second column and the displaced volume for an IOM weighing 4kg in air can be calculated as in the next table:
Table 2 Displaced Volume Calculation
|
Headings |
Fresh Water |
Salt Water |
|
Total displaced volume, |
.004 |
.0039024 |
|
Displaced Volume, keel and bulb |
.000290 |
.000290 |
|
Displ. Volume, rudder |
.000025 |
.000025 |
|
Required Displaced Volume of Hull |
.003685 |
.003587 |
In practice it is close enough to use .00369 cubic metres for fresh and .0036 for salt.
There is a common perception that unless a boat is designed to 4kg it will float low with its ends in the water when they have carefully been designed just to clear the surface. In fact, a boat so designed will float about 2.5mm higher than in the design program, and this is barely enough to allow for the surface tension of the water raising a meniscus around the hull.
The spreadsheet relies on referring to the true displaced volume of the design in question, that is either .00369 or .0036 and using the hull parameters for a displacement to 4kg will give thoroughly misleading results. Most common design programs will allow the draft to be changed to give the correct displacement without changing the shape at the end of the design process, and the parameters for this condition should be used in the spreadsheet.
The author prefers to design for the actual displacement and raise the stern clear of the water by 4 or 5 mm which is the practice with most successful boats. Most also raise the bow.
2.1.2 Inputs LCB and LCW.
For the purposes of this calculation these are measured from the “forward perpendicular”, which can be taken as the forward end of the waterline. Some design programs measure these dimensions from the transom (e.g. Freeship) and so it is necessary to correct these before entering the values in the spreadsheet.
2.1.3 Scaling
Most design programs are intended for full size boats 10 metres or more long, and many run into numerical problems with model yachts: for example Freeship rounds off the displacement to the nearest kilogram. To get around this it is best to design the shape at, say, 10 metres long and then alter the dimensions before putting them in the spreadsheet. For lengths divide by 10, for areas divide by 100, for displacements divide by 1000, and for righting moments divide by 10,000.
2.2 Calculation
This sheet is the engine of the workbook. It is write protected so the formulae cannot be inadvertently changed.
2.3 Drag Plots
This sheet presents the drag versus speed results in graphical form. These are updated automatically as soon as a new boat is entered. A high and low speed graph are provided to give a bigger scale for the graph.
Figure 2 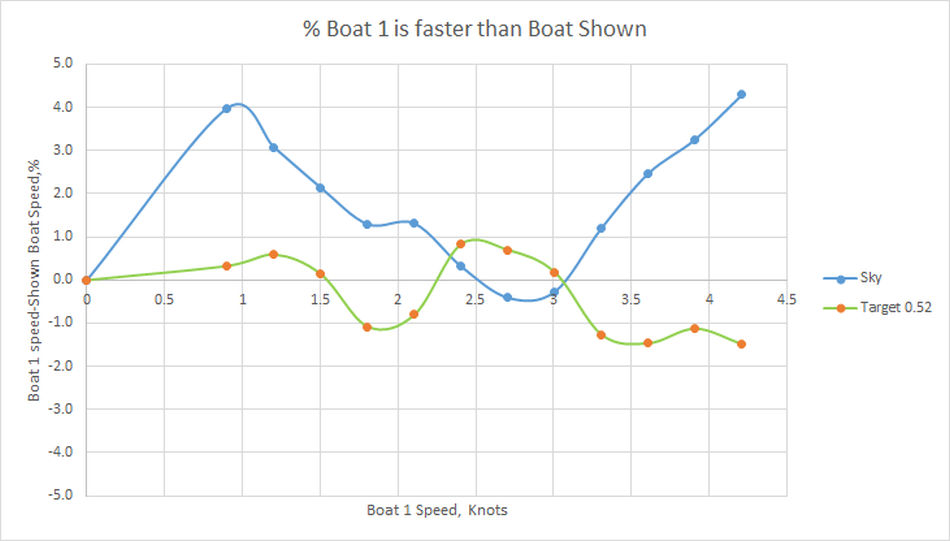
There is also a % faster than graph (See Figue 2). This compares the boats whose inputs are in columns E and F on the Input Sheet with the boat whose input data is in Column D (called “Boat 1” here, the identity of Boat 1 is given just above the chart). If the boat is slower than boat 1 then the numbers are positive, but if the boat is faster than boat 1 the value is negative.
Thus if it is desired to get a boat faster than boat 1, negative values are wanted! In the example, Sky is not very good as boat 1 is faster for almost the whole range, on the other hand Target 0.52 looks to be a bit better than Boat 1. The graph is set to show differences of +- 5%, however the scales can be changed if required, to do so click on the vertical axis and select "Format Axis" then alter the range.
2.4 Plots
This sheet has been prepared for the more sophisticated users! The intent of the data on this sheet is to allow a study of the components of residual drag. These are updated automatically as soon as a new boat is entered. The other part of drag, skin friction is pretty much determined by the wetted surface, but residual drag is more complex. The sheet shows the contribution of each term to the residual drag. Where the values are positive they are adding to drag and where negative they are reducing drag. The relative magnitude of the terms is also worth studying. It might be thought that improving a boat is just a matter of reducing terms that add to drag and increasing those that decrease it. In practise it is more complex because when the shape is altered to optimise one term is will also change the others! Each of the terms is described below:
Term 1 LCB/LWL : The graph suggests that the further aft the centre of buoyancy is the better except at high speeds. This is a big contributor to the total drag through most of the range.
Term 2 Cp: This is a measure of how the buoyancy is distributed, a large Cp has the buoyancy out towards the ends and away from midships while a small Cp indicates the reverse. A high Cp is generally linked to better medium high speed performance.
Term 3 is (Displaced Hull Volume)^2/3/AWP: The displacement is effectively fixed, so a large value of AWP (area of the water plane) looks good at high speed, but such values are associated with high wetted surface and adversely affect other parameters.
Term 4 is BWL/LWL: Clearly narrow boats are favoured except at 2 to 3 knots.
Term 5 is LCB/LCF: the ratio of the distance of the centre off buoyancy from the forward end of the waterline to that of the centre of area of the water plane. Low values of this ratio are beneficial though the whole speed range.
Term 6 is BWL/Tc: the ratio of the waterline beam to the draft. For most of the range this wants the draft increased and the waterline beam reduced.
Term 7 is Cm: This describes the shape of the midships section, a triangular section has a low Cm and a rectangular section a high one. There is a difficult choice here because a small value is good up to about 3 knots and then bad at high speed.
Have fun!
Col Thorne August 2014
Appendix Basis of calculations
A1.0 Residual Drag
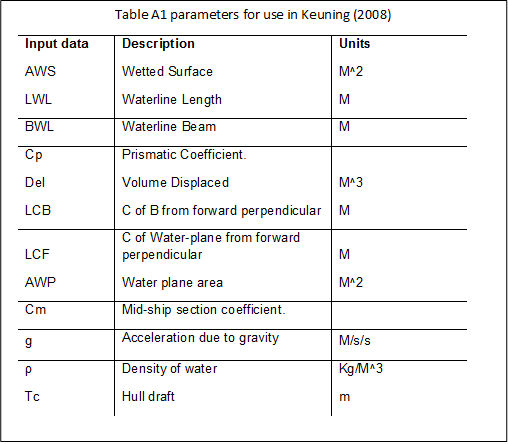
This is based on the Delft Yacht Series as in Keuning (2008). It is an empirical method based on the statistical analysis of lots of tests rather than one built up from first principles of fluid mechanics. Definitions for the input data for the equations of the method are given in Table A1 and in cells A5 to A16 of the Input Data Sheet. These parameters are provided in the output of most hull shaping designs.
The equation for this method is:

The parameters a0, a1 etc. have been derived statistically and are given in Table A2 as a function of the Froude Number Fn. This is a general value indicating the speed relative to the boat size. To calculate the speeds for your boat, use:
v=Fn*√(9.81*L)
Where v is the boat speed in m/sec and L is in metres. For most IOM designs this will give speeds from around 0.9 knots up to about 4.6 knots.
Because this is an empirical method, errors can occur if it is applied to boats too different from those tested. The most serious limitation for IOM designs is the waterline beam. The lowest waterline beam to waterline length ratio in the tests was 0.17, so some loss of accuracy can occur for really skinny hulls. The other ranges are shown in the Input Data, Columns G, H and I.
In addition, the Delft series did not include any mpdels with chines. If heeled hydrostatics are used then the effect of the chines on the hydrostatics will be covered but not the fluid dynamic effect of the sharp corner.
A2.0 Skin Friction Drag
A2.1 Calculating Reynold’s Number
A discussion of the skin drag as compared to conventional methods is described on this website in Hulls/Drag Measurements on an International One Metre Yacht, and will not be repeated here. The first step is to calculate the Reynold’s Number for each of the boat speeds that arise from the residual drag calculation. The Reynold’s numbers give an indication of the nature of the flow round the hull at each speed and are calculated as shown in the equation below.
Reynolds Number, Re=VbL/v
where:
Vb= Boat Speed in m/sec (= 0.514* Knots)
L= characteristic length (0.7*LWL for most hulls), m
ν= kinematic viscosity, this varies with temperature and salinity
The data in Table A2 is from ITTC Recommended Procedures 2011 rev 2.
Table A2 Properties of water
|
Temperature |
Fresh, density, kg/m^3 |
Fresh, Kinematic Viscosity m^2/s
|
Salt water, density kg/m^3 |
Salt water, Kinematic viscosity m^2/s |
|
10 |
999.7 |
1.31*10^-6 | 1027.0 | 1.36*10^-6 |
|
15 |
999.1 |
1.14*10^-6 | 1026.0 | 1.19*10^-6 |
|
20 |
998.2 |
1*10^-6 |
1024.8 | 1.051*10^-6 |
|
25 |
997.00 |
0.893*10^-6 | 1023.4 | 0.937*10^-6 |
It is interesting to note that the viscosity, which is part of the Reynold’s Number, varies quite a bit with temperature. Because I live in a temperate part of Australia I normally use 20 degrees but in Europe or North America I understand 15 degrees is more commonly used. Once the Reynold’s numbers have been calculated the skin friction coefficients can be calculated.
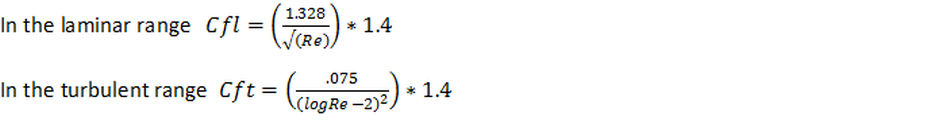
A2.2 Skin Friction Coefficients
The equations for the skin friction coefficient are given below. The usual values are the ones in brackets but to make the calculation give the right answer it was found necessary to increase the usual coefficients by 40%, hence the 1.4 factor. The reason for this is not clear, though it is speculated that it may be due to surface tension.
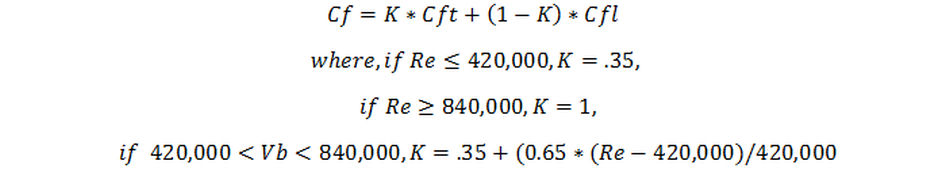
 It was found that the proportion of the boat with turbulent flow varied with speed, from about 35% below Reynold’s number of 420,000 to 100% by a Reynold’s Number of 840,000. If "F" is this proportion then the skin friction coefficient for the whole boat is:
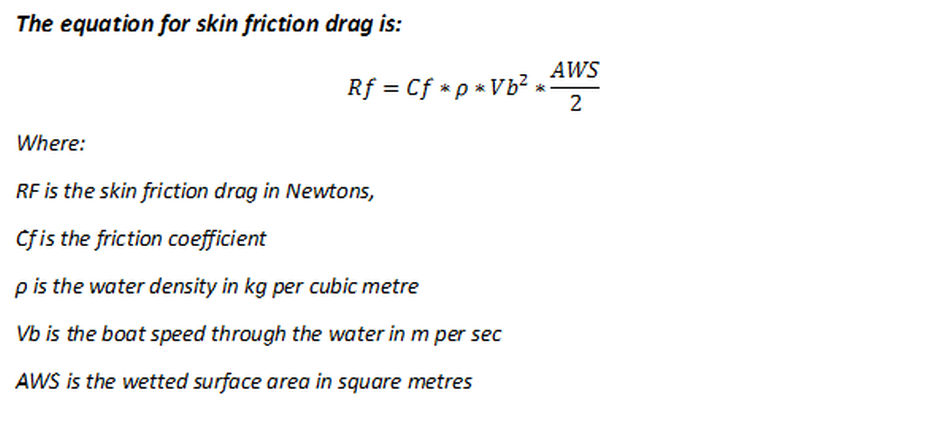
A3.3 Calculating Skin Friction
Once the coefficients for the particular boat speeds have been calculated the total skin friction drag can be calculated as follows:
Equn
A4.0 Total Drag and comparison with measured values
To obtain the total drag, the friction drag and the residual drag are added together for each boat speed. Thus the total drag at each speed is:
Rt=Rf+Rw
The first set of drag measurements was reported in Hulls/Drag Measurements on an International One Metre Yacht on this website. Since then some other measurements have been made and these are compared with the values calculated as above. The results are provided in Figure 1. The agreement is good for such a difficult problem. It should be noted that the natural scatter in the test results is actually more than the difference between reasonable designs, but fortunately in calculations like this, the prediction of the difference between boats is commonly much more accurate than the absolute values so the lack of great precision in the experimental data does not mean that useful comparisons cannot be made between designs using the methods above.
If the necessary parameters can be obtained for the boat at different pitch and heel angles the method can be used to look at this aspect. Often hulls that look similar when upright and on their waterlines are quite different when heeled.
References
Keuning, J.A., and Kargert, M.; A Bare Hull Prediction Method Derived from the results of the Delft Systematic Yacht Hull series extended to higher speeds; International Conf on Innovation in High Performance Sailing Yachts, Laurient, France, 2008
Fossati, F. Aero-hydrodynamics and the performance of sailing yachts. Allard Coles Nautical London 2009
Happy designing!
Col Thorne August 2014