Drag Measurements on an International One Metre Yacht
Abstract
The hydrodynamics of radio control yachts generally and International One metre Class yachts particularly are considerably more complex that that for full size yachts because they operate through the range of Reynolds Numbers that spans laminar flow to turbulent flow in flat plates, and also because at this scale surface tension can affect both the water forces around the waterline and also the wave formation made by the hull.
A series of drag measurements was made on an older IOM design (Hull A) and a few on an even older IOM (Hull B). The results of these measurements were compared to various theoretical predictions to investigate what areas deserve further investigation.
There were three findings from this work:
The measured skin friction of the hull was at least 30% more than the author anticipated. This needs to be checked with more accurate measurement systems and is worth investigation with an assessment of the role of surface tension and possibly hull surface coatings, since this represents a chance to make a substantial improvement in performance.
Adding the skin friction drag as described in Section 3 to the residuary resistance predictions from Keuning (2008) gives results that show a very nice fit to the observed drag values within the test range of up to 2.5 knots. Pending further data, this seems a reasonable empirical formulation for IOM drag prediction, though the physics of why any non surface friction drag should increase with speed squared is not clear.
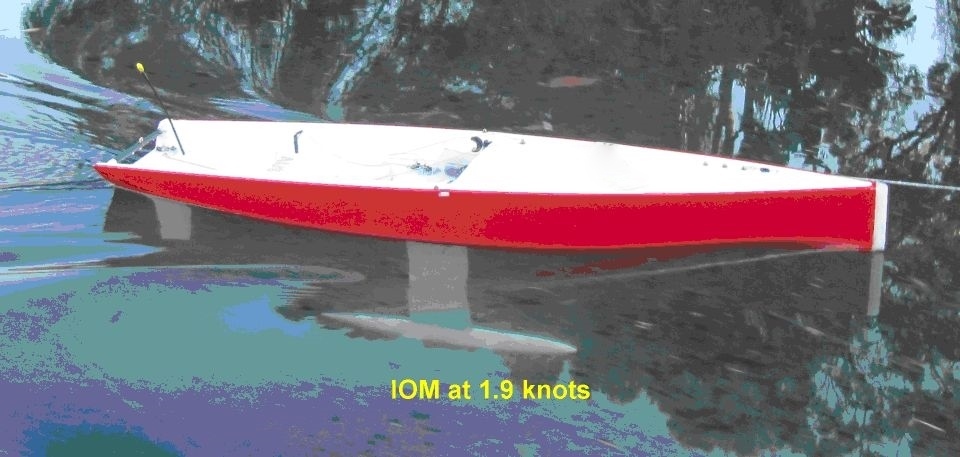
The author measured an average speed on the downwind leg at the 2011 Nationals as 5 knots in a strong C rig breeze and with considerable help from wave surfing. Thus tests to this speed should be adequate.
There was also the apparent sudden increase in keel and bulb drag at 1.5 knots. The data without the keel at higher speeds was sparse and scattered, better data is needed before this can be considered proven behaviour.
1.0 General
This article describes towing tests done in April and May 2012 at the lower end of Pittwater, an estuary north of Sydney. The aim of the tests was to allow comparison of the measured drag with predictions made using common methods.
The tests were done by towing the boat from a point beside, but well clear of any wake of a dinghy fitted with an electric outboard with a built in GPS. Time trials showed the speed readout to be accurate to 0.05 knots. Drag was measured with a simple but carefully calibrated gauge. The calibration of the gauge used to measure drag forces is given in Appendix 1.
All tests were done in the morning with a glassy water surface and no discernable wind. There was a slight undulation in the water surface but not enough to cause any pitching of the hull, and the water temperature was estimated as 20 degrees centigrade. No attempt was made to allow for the bow down moment caused by the sails both because the data to evaluate the moment was not known and because this investigation was about fundamentals.
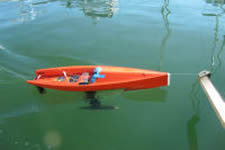
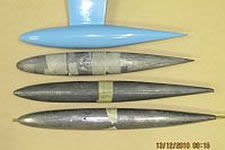
Most tests were done on hull A fitted (in the keeled tests) with an Obsession keel and a Sails Etc bulb. The hull was not new but had sheen and a few small scratches on the starboard side. When in the water a meniscus could be seen at the stern. The test series were as follows:
(a) With keel and rudder and weighted to a total of 4 kg using weights attached to replace the rig weight at a position closely approximating the rig C of G. A limited number of tests were also done on a Hull B with the surface wet sanded with 400# paper, this boat had a TS2 style keel and bulb.
(b) With the keel removed from the and internal lead ballast added to bring the weight of the whole to 4kg less the buoyancy from the keel and bulb, estimated as 300g. Care was taken to ensure the centre of gravity was maintained in the same place as in the keeled tests, and the keel slot was covered by smooth waterproof tape. All these were on Hull A
(c) As (b) above but with three turbulence inducing strips in the forward half of the hull. All these were on Hull A
2.0 Keel and Bulb Drag
Normal methods of hull drag prediction are for the hull only. It is impracticable to tow a boat without a rudder, and so an estimate of appendage (keel, bulb and rudder) drag is necessary.
Figure 1 Shows the drag for the Hull A in Newtons (9.81 N= 1 kg) measured in Series (a) with the keel and bulb in place, plotted against boat speed as yellow triangles. The yellow curve is a line of best fit to these data. Likewise the drag from Series (b) (Hull A without the keel and bulb) is shown as pink squares and the curve of best fit is in pink.
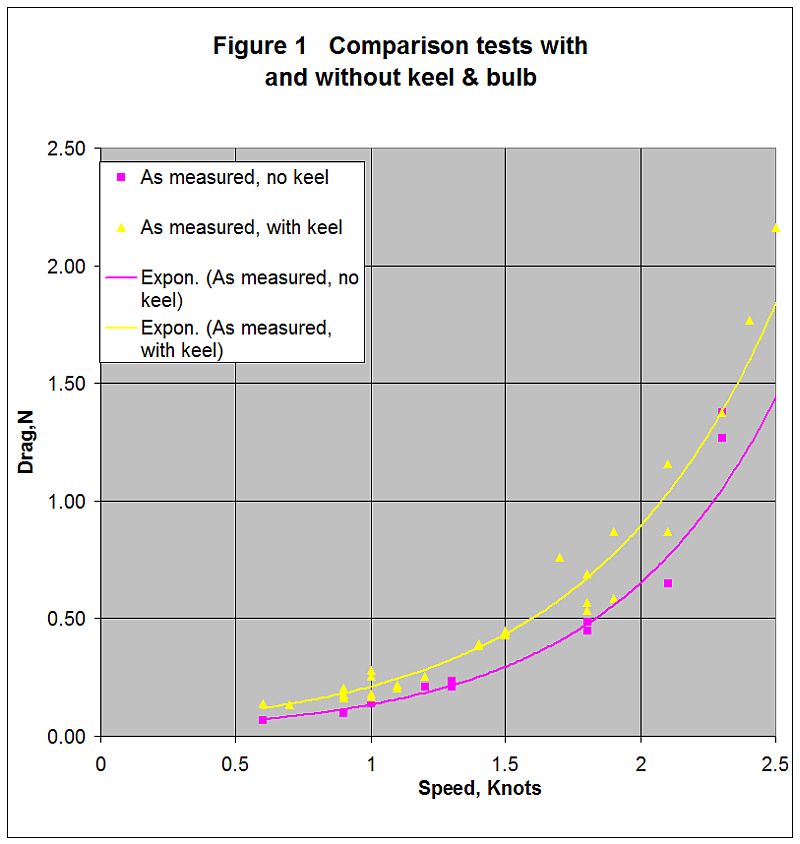
The drag from the keel and bulb is the difference between these two curves, which is shown in Figure 1 as the pink curve with square dots.
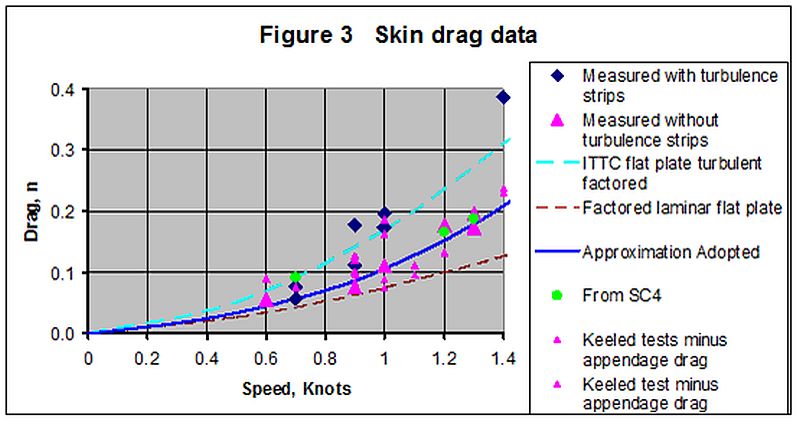
The theoretical drag for the keel and bulb was estimated using data for low Reynolds numbers published by Selig et al and the results are also plotted in Figure 2 as a blue solid curve. At speeds below 1.5 knots the theoretical drag is reasonably close to the measured drag, however beyond that the measured drag increases sharply. It was determined that this was not just the result of the mathematical form of the trend lines in Figure 1 by using different mathematical forms for the trend lines, the result was also unchanged by removing individual data points. The result is thus reasonably robust, however clearly more data at speeds over 1.5knots is needed for confirmation.
In the interim, however, for the purposes of reducing the measured drag to that of the hull, the values shown by the blue dots was adopted as the keel and bulb drag. The rudder drag was estimated from the Selig data by the same means as for the keel and was used unchanged on the grounds that there was no data to show whether or not the rudder experienced the same turbulence. This uncertainty in the rudder drag affects the implied bare hull drag by less than 3%.
3.0 Skin Friction
In towing tank testing the objective is usually to predict the behaviour of much larger boats than that tested, and as a result the models towed are fitted with turbulence strips or studs on the hull to ensure that the flow round the model is turbulent. IOM’s are smaller than most models tested these days and are certainly not fitted with strips or studs.
The transition between turbulent and laminar flow is often quoted as between Reynolds numbers of between 500,000 and 1,000,000. Now an IOM reaches 500,000 at about 1.5 knots and 1,000,000 at about 3 knots so it lands in the difficult transition area. Also there is no reason to believe that a hull will see the same transition zone as a fully submerged flat plate, especially since there is an air/water interface and a keel and rudder to create turbulence, and also a bow bumper that is rarely hydro-dynamically smooth.
This form of drag clearly is a good one to investigate. It can be seen from the next section that residuary drag is negligible at speeds up to about 1.25 knots, and hence the results from lower speeds are useful for examining skin friction behaviour.
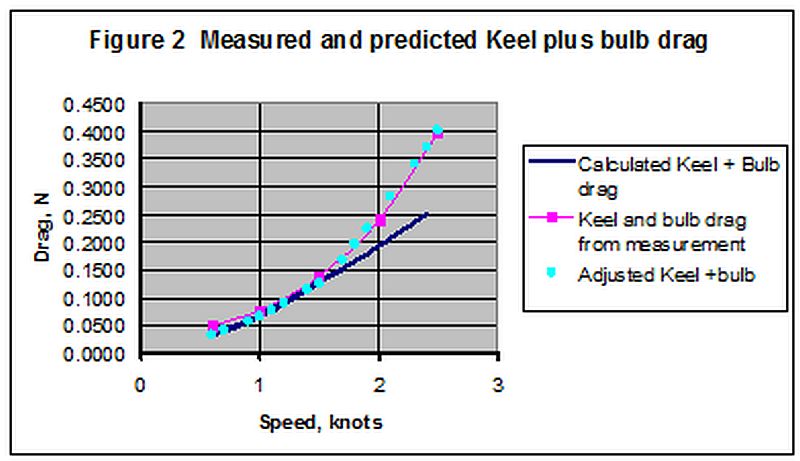
Figure 3 shows the drag value from the un-keeled tests (Series (b)) with the drag reduced by the estimated rudder drag (a rather small correction) as pink triangular symbols. Also shown is the same thing for tests with turbulence strips as blue diamond symbols.
It should be noted that the wetted surface of most of the general type of IOM designs falls within a relatively narrow range, of about .147 to .154 square meters. In the absence of lines plans, an estimated value of 0.148 was used.
Because boats are curved rather than flat, a “Form Factor” is used to move from the flat plate value to one for the actual boat. The ITTC (1957) turbulent drag factor used includes a 1.12 shape factor but it was necessary to add a further 40% to give the dashed blue curve, which is in reasonable agreement with the data from the Series with turbulence strips (Series (c)). This implies a total shape factor of 1.57.
Using the same form factor with the laminar values for a flat plate gives the dotted brown curve. It is obvious that this is below the drag measured without turbulence strips (Series (b)), so there must be some turbulent areas along the hull, which is not surprising for the reasons given above.
It was found that an assumption of 35% turbulent flow and 65% laminar with a shape factor of 1.57 for both gives a reasonable fit to the bare hull data around 1 knot. This is shown as the solid blue line on Figure 3, and compares with the measured bare hull data shown as pink triangles.
The data shows that the drag for the cases with and without turbulence strips converge to be similar by 2 to 2.5 knots. For the purposes of the next section it was assumed that the transition from 65/35 laminar turbulent to 100% turbulent would be completed by 2.5 knots and the solid dark blue line shows these values.
The round green dots on Figure 3 are from the tests on Hull B with the calculated appendage drag subtracted from the measured values. They are in the same order of those of Hull A, suggesting that these high values are not solely attributable to the shape of Hull A.
It must be said that the form factor of 1.57 is extremely high and it begs the question as to whether there may be some other form of drag operating. The accuracy of the gauge is worth further improvement but is thought unlikely to be bad enough to cause such a high value. The resistance for an apparent wind blowing head on was calculated as .002N for 1 knot and .008N at 2 knots. It is therefore unlikely that this was a contributory factor.
Surface tension is another area worth examining; we all remember the toy boats that whizzed around the bath with a bit of camphor on the back. The surface tension of water is 0.078N/m and around the perimeter of the waterline of an IOM this amounts to about 0.16N. Only a small fraction of this would make a substantial contribution to the drag.
4.0 Residuary Resistance Prediction Methods and total resistance
Resistance prediction methods are at the heart of most performance prediction programmes. This section reviews the predictions from some current methods with the observed results. There are two parts to this, skin frictional resistance and residuary resistance. Other sources such as that due to heeling or waves are outside the scope of these notes.
Skin frictional resistance was discussed in the last section. This section looks at predictions of residuary drag and total drag. For the purposes of examining these predictions, data were used from a generic IOM design similar in type to Hul A. The data used for input are presented in Appendix 2.
The yellow chain dotted lines in Figure 4 show the residuary resistance for this generic IOM design using the method of Gerritsma (1996) as used in the hull design program Hullform 9P. The shape of an IOM is actually outside the limits of validity of this method, which is similar though not identical to the one used in Delftship. The Delft yacht series has been extended to cover longer thinner and faster boats and a method was presented in Keuning (2008). The residuary resistance calculated for the same generic IOM design using this method is shown in the thin green dotted line in Figure 4. The results are roughly similar to, but lower than that of Gerritsma (1996).
The Delft series hulls also have overhangs, which the IOM does not. An estimate of the added drag from the lack of overhangs was made from data in Keuning (2008) and the resulting residiary drag with this addition is shown by the thick green line. This effect does not apply at speeds below about 3 knots.
It should be noted that in the Delft series the residuary drag is calculated from the towing tank tests using only the 1957 ITTC value (which has a form coefficient of 1.12), for all turbulent drag coefficients. This is because of the difficulty in measuring accurate drag values at low speeds in test tanks and the subsequent uncertainty of form factors.
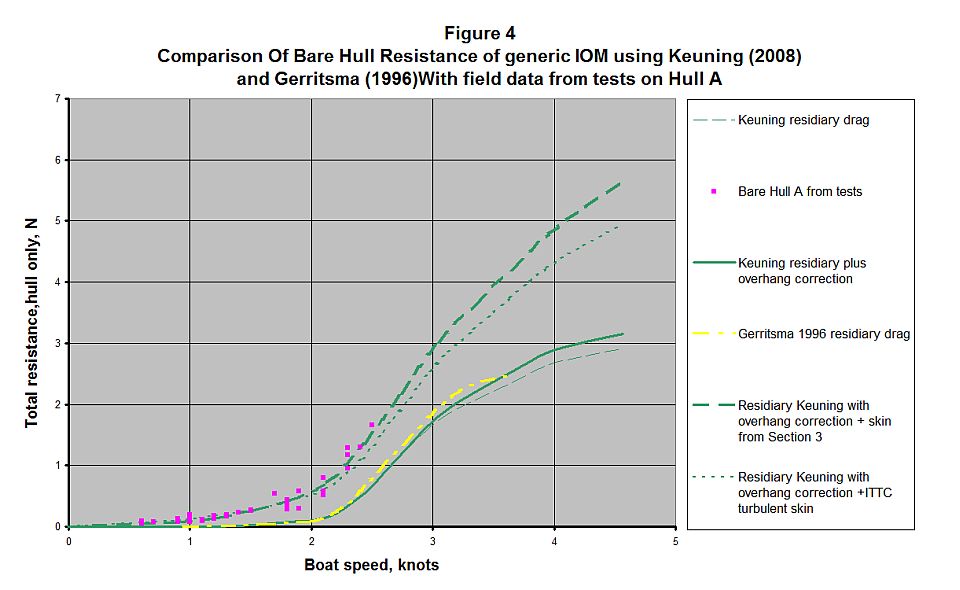
If this usual Delft system is followed, the drag curve shown as a thin dotted blue line is obtained. It will be seen that it slightly overestimates the drag at low speeds and underestimates the drag at higher speeds by up to 15%. Clearly, some different formulation is required. The Delft series was aimed at predicting the drag of yachts 10 to 15m long, not downwards to 1 metre, and the models had water line lengths of 1.6m in the initial set and 2m thereafter. Steps to avoid surface tension effects are sometimes taken in towing tests but even so the potential effects on models this size would be substantially less than on an IOM.
Adding the skin friction drag as described in Section 3 to the residuary resistance predictions from Keuning (2008) gives results that show a reasonable fit to the observed drag values within the test range of up to 2.5 knots and is shown by the solid green line. Pending further data, this seems a reasonable empirical formulation for IOM drag prediction, though the physics of why any non surface friction drag should increase with speed squared is not clear.
5.0 Discussion
There were three findings from these tests that deserve more investigation with better experimental methods:
The measured skin friction of the hull was at least 30% more than the author anticipated. This needs to be checked with more accurate measurement systems and is worth investigation with an assessment of the role of surface tension and possibly hull surface coatings, since this represents a chance to make a substantial improvement in performance.
Combining the skin friction data calculated as in Section 3 with the calculated residiary drag calculated from Keuning (2008) gave reasonable agreement with observed data up to the top of the test range i.e. 2.5 knots, though the physics of this is not clear. Most club boats are in this range about 90% or more of the time, however the calculations have been only demonstrated to 2.5 knots and may to be incorrect above this, so checking above this level is clearly desirable.
The author measured an average speed on the downwind leg at the 2011 Nationals as 5 knots in a strong C rig breeze and with considerable help from wave surfing, so tests to this speed should be adequate.
There was also the apparent sudden increase in keel and bulb drag at 1.5 knots. The data without the keel at higher speeds was sparse and scattered, and better data is needed before this can be considered proven behaviour.
This series of tests is only a beginning and not an end to the investigation into the basics of IOM behaviour. The tests also need to be extended to other designs with different surfaces to those tested. Better experimental techniques have been developed which will hopefully decrease the scatter in results.
Acknowledgments:
The Author would like to thank Phil Best and Bob Vine who assisted in the tests, and Julian Bethwaite and Simon Wotin who obtained the Keuning reference for me.
References:
Keuning, J.A., and Kargert, M.; A Bare Hull Prediction Method Derived from the results of the Delft Systematic Yacht Hull series extended to higher speeds; International Conf on Innovation in High Performance Sailing Yachts, Laurient, France, 2008
Fossati, F. Aero-hydrodynamics and the performance of sailing yachts. Allard Coles Nautical London 2009 Marchaj, C.A Sailing Theory and Practic3. Allard Coles Nautical, 1964
Gerritsma (1996) from the hull design program Hullform 9P.
Bantok, G. Article in Seahorse Magazine
Selig, M., Donovan, J. and Frazer,D. Summary of low speed airfoil data Vol 1 From soartech-aero.com
Selig, M., Donovan, J. and Frazer,D Airfoils at low speeds From soartech-aero.com
Appendix 1
Calibration of drag measurement gauge 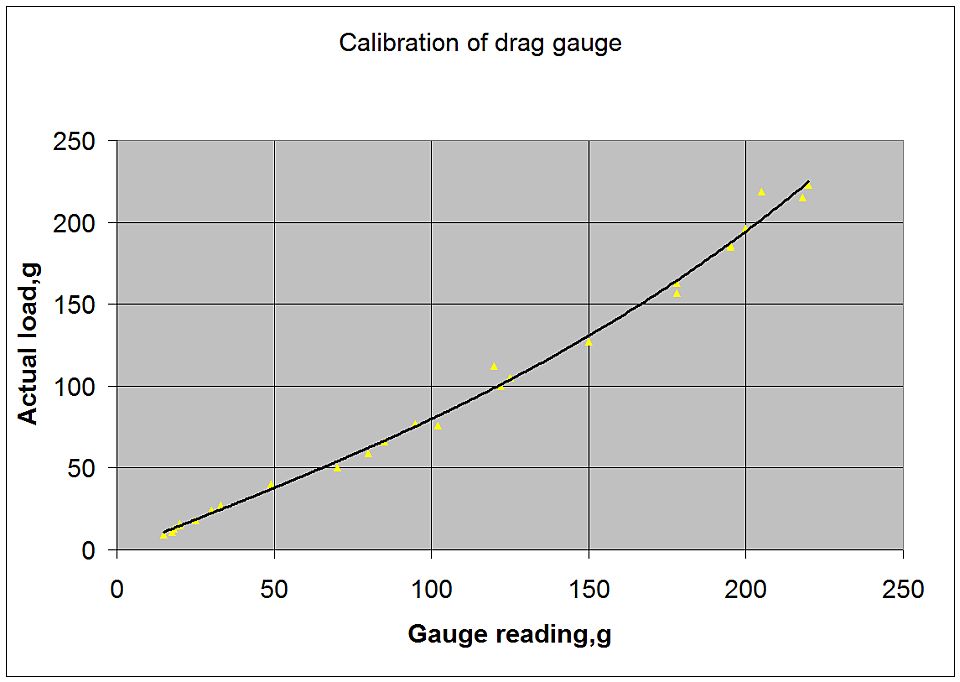
Appendix 2
Data used for residiary drag calculation using Keuning (2008).
Input data: Description, Units, Generic IOM:
AWS Wetted Surface M^2 0.14739
LWL Waterline Length M 0.9905
BWL Waterline Beam M 0.175
Cp Prismatic Coefficient. 0.52
Del Volume Displaced M^3 0.003609
LCB C of B from forward perpendicular M 0.5181
LCF C of Water-plane from forward perpendicular M 0.5518
AWP Water plane area M^2 0.11452
Cm Mid-ship section coefficient. 0.723
g Acceleration due to gravity M/s/s 9.81
ρ Density of water Kg/M^3 1025
Tc Hull draft m 0.056